In practice,
however, we notice something different: an increase in the aperture (given the
same quality of the telescopes) from 100 to 200 mm increases the perception of
details enormously, and a further increase to 400 mm brings another considerable
improvement, and not only under the very best seeing conditions. What is the
reason for this?
To understand
this, we need to look more closely at the underlying detail of contrast and
contrast transfer through the telescope. A very good introduction to this topic
can be found in the highly recommended book "Telescope
Optics" by Harrie Rutten and Martin van
Venrooij (Willmann-Bell Inc.,
Richmond, VA, USA). The following reasoning essentially follows that of Martin
van Venrooij
in chapter 18.7 of this book. The contrast between, for example, two
surface details of a planet is caused by their different brightness or
intensity. The contrast K between a lighter and a darker detail is defined by
K=(Ih-Id)/(Ih+Id), where Ih
and Id are the respective intensity values. This contrast value
ranges from 0 (no conrast) to 1 (maximum contrast). This contrast is transmitted
by the telescope into the image plane and the relationship between original
contrast and transmitted contrast is described by the so-called contrast
transfer function, CTF, (or optical transfer function, OTF, or modulation
transfer function, MTF), which results from the underlying physics of wave
optics.
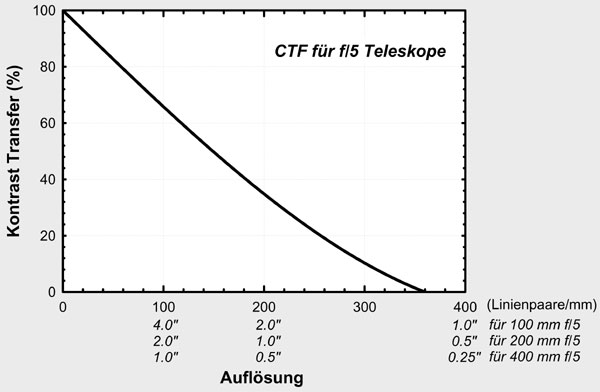
Figure 1:
Contrast transfer function for f/5 telescopes depending on the linear resolution
and angular resolution for perfect telescopes of 100, 200, and 400 mm aperture.
The CTF
provides information on how much of the contrast of a line pattern with an ideal
sinusoidal intensity distribution arrives in the image plane, depending on the
distance of the lines in this pattern (relative to the image plane) or their
apparent angular distance. Such artificial line patterns may seem somewhat
bizarre in daily life, but it results directly from the underlying theory. Each
image can be divided into a superposition of an infinite number of such line
patterns. The technical term for this is Fourier decomposition, which plays a
very important role in physics.
Figure 1 shows
such a CTF calculated for a perfect telescope with an aperture ration of f/5,
depending on the spatial frequency of the line patterns (in pairs of lines per
mm), which is independent of the aperture or its angular distance. In terms of
angular resolution, the CTF depends on the aperture of the telescope, which is
reflected in the different X-axis scales for our standard 100, 200, and 400 mm
telescopes. So what does this CTF tell us? First of all, the CTF of our perfect
telescopes has a value of 100% only if the number of line pairs per mm goes to
zero, corresponding to very large details. For finer details, the contrast
transfer decreases continuously and reaches zero at about 360 line pairs per mm.
This value also corresponds to the theoretical resolution limit of 1.1, 0.6 and
0.3 arcseconds for our three standard telescopes mentioned above. For comparison
only, the diameter of the Airy disc corresponds to a local frequency of about
150 line pairs per mm for our telescopes.
This tells us
that the contrast of finer details is less likely to be transmitted than that of
coarser details. The picture thus becomes duller, the finer the details we look
at. If we assume a maximum object contrast of 1, then Figure 2 shows what is
left of this initial contrast in the image plane.
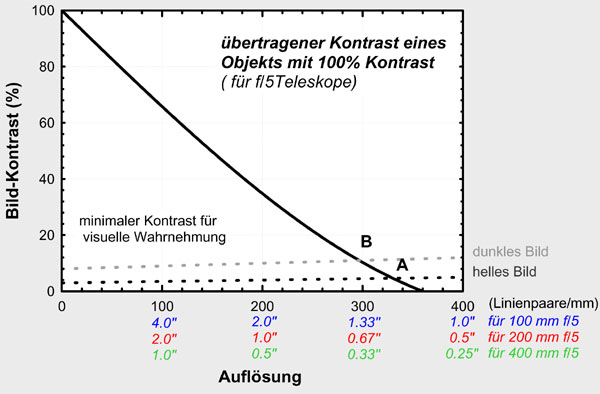
Figure 2
In order for
our eye to be able to distinguish two surface details, their image contrast must
have a certain minimum value. In his book, Martin van Venrooij
assumes a 5% contrast for fine details and a slightly lower value for
coarser details. These values may, of course, vary from observer to observer as
well as with external conditions. Details with an image contrast lower than this
threshold would therefore no longer be perceived to have different brightness.
These minimum values apply to a bright image and correspond to the dashed black
line in Figure 2. For a less bright image, the minimum contrast for visual
perception is even slightly higher, as indicated by the gray dotted line in
Figure 2. At first sight, this is not too bad: the maximum achievable resolution
that can be obtained (which is reached as soon as the contrast curve intersects
the dashed lines, i.e. in points A
and B, depending on the image brightness) is not far from the theoretical
resolution of the optics (intersection of the contrast curve with the X axis).
Furthermore, at least with apertures of 200 and 400 mm, it is still better than
the limits typically imposed by the seeing.
However, keep
in mind: The contrast shown in Figure 2 is the image contrast
transmitted by an object with a maximum contrast of 1. Details, as e.g.
banding or whirls in the atmosphere of Jupiter or any other planet, have,
however, no intrinsical contrast of 1, but a contrast that is *considerably*
lower. Let us look, for example, at the fine details of the whirls in the
equatorial bands of Jupiter and assume an intrinsical contrast of 0.1 or 10% for
them (which is realistic). The image contrast of an object with an intrinsical
contrast of 0.1 can be seen in Figure 3 as a gray solid curve, compared to our
previous example with object contrast 1.0 in black.
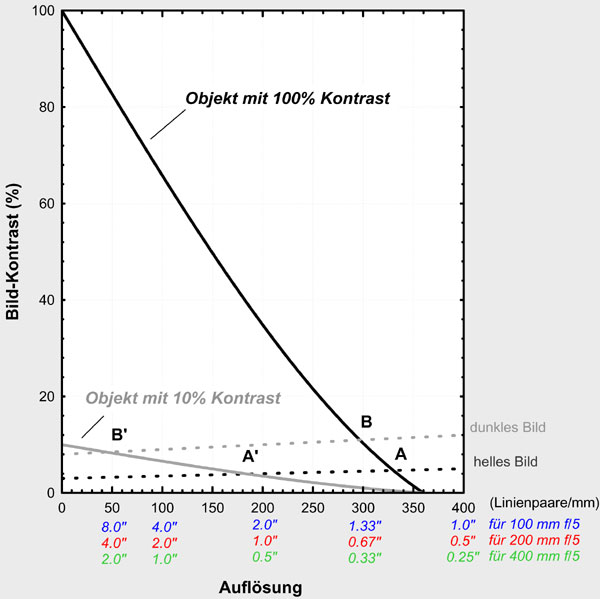
Figure 3
Let us now
look again at the maximum resolution that we can obtain and compare it to the
Dawes limit. While the intersection A of the black dotted line (for a bright
image) with the black contrast curve for the 100% object was still close to the
theoretical value, it is now considerably shifted to the left to A'. The
visual resolution for a bright image of planetary details with 10% intrinsical
contrast is less than 2.0, 1.0 and 0.5 arcseconds for our three standard
telescopes. If we continue to take into account that the image (at the same
magnification) appears darker in the telescopes with a smaller aperture than,
for example, in the 400 mm telescope, the contrast threshold in the smaller
telescope will also be higher than in the larger one. The maximum resolution,
that can be achieved, thus moves from A' to B' for smaller telescopes. And all
of a sudden, it is in a range which it is far from the theoretical Dawes
resolution limit of the optics. Even under only moderate seeing conditions,
resolution will no longer be determined by the seeing itself, but by the optical
properties (primarily the aperture) of the telescope.
The achievable resolution for e.g. planetary details can thus be considerably lower than the theoretical resolution limit of the telescope. It is essentially determined by two factors, namely the image contrast of the details (which in turn depends on the intrinsic contrast of the observed structures) and the contrast threshold of the eye, which depends on the brightness of the image.